Enclosure Number :
-
Location Description :
-
Longitude/Latitude :
-
Ongoing Notes :
Sensor Data
Under no circumstances shall Brent Webre Automation be liable for damage or loss of any kind, user assumes entire risk, application is for general information purposes only and is provided as is.
Data provided by Smart Sea Level Sensors Project.
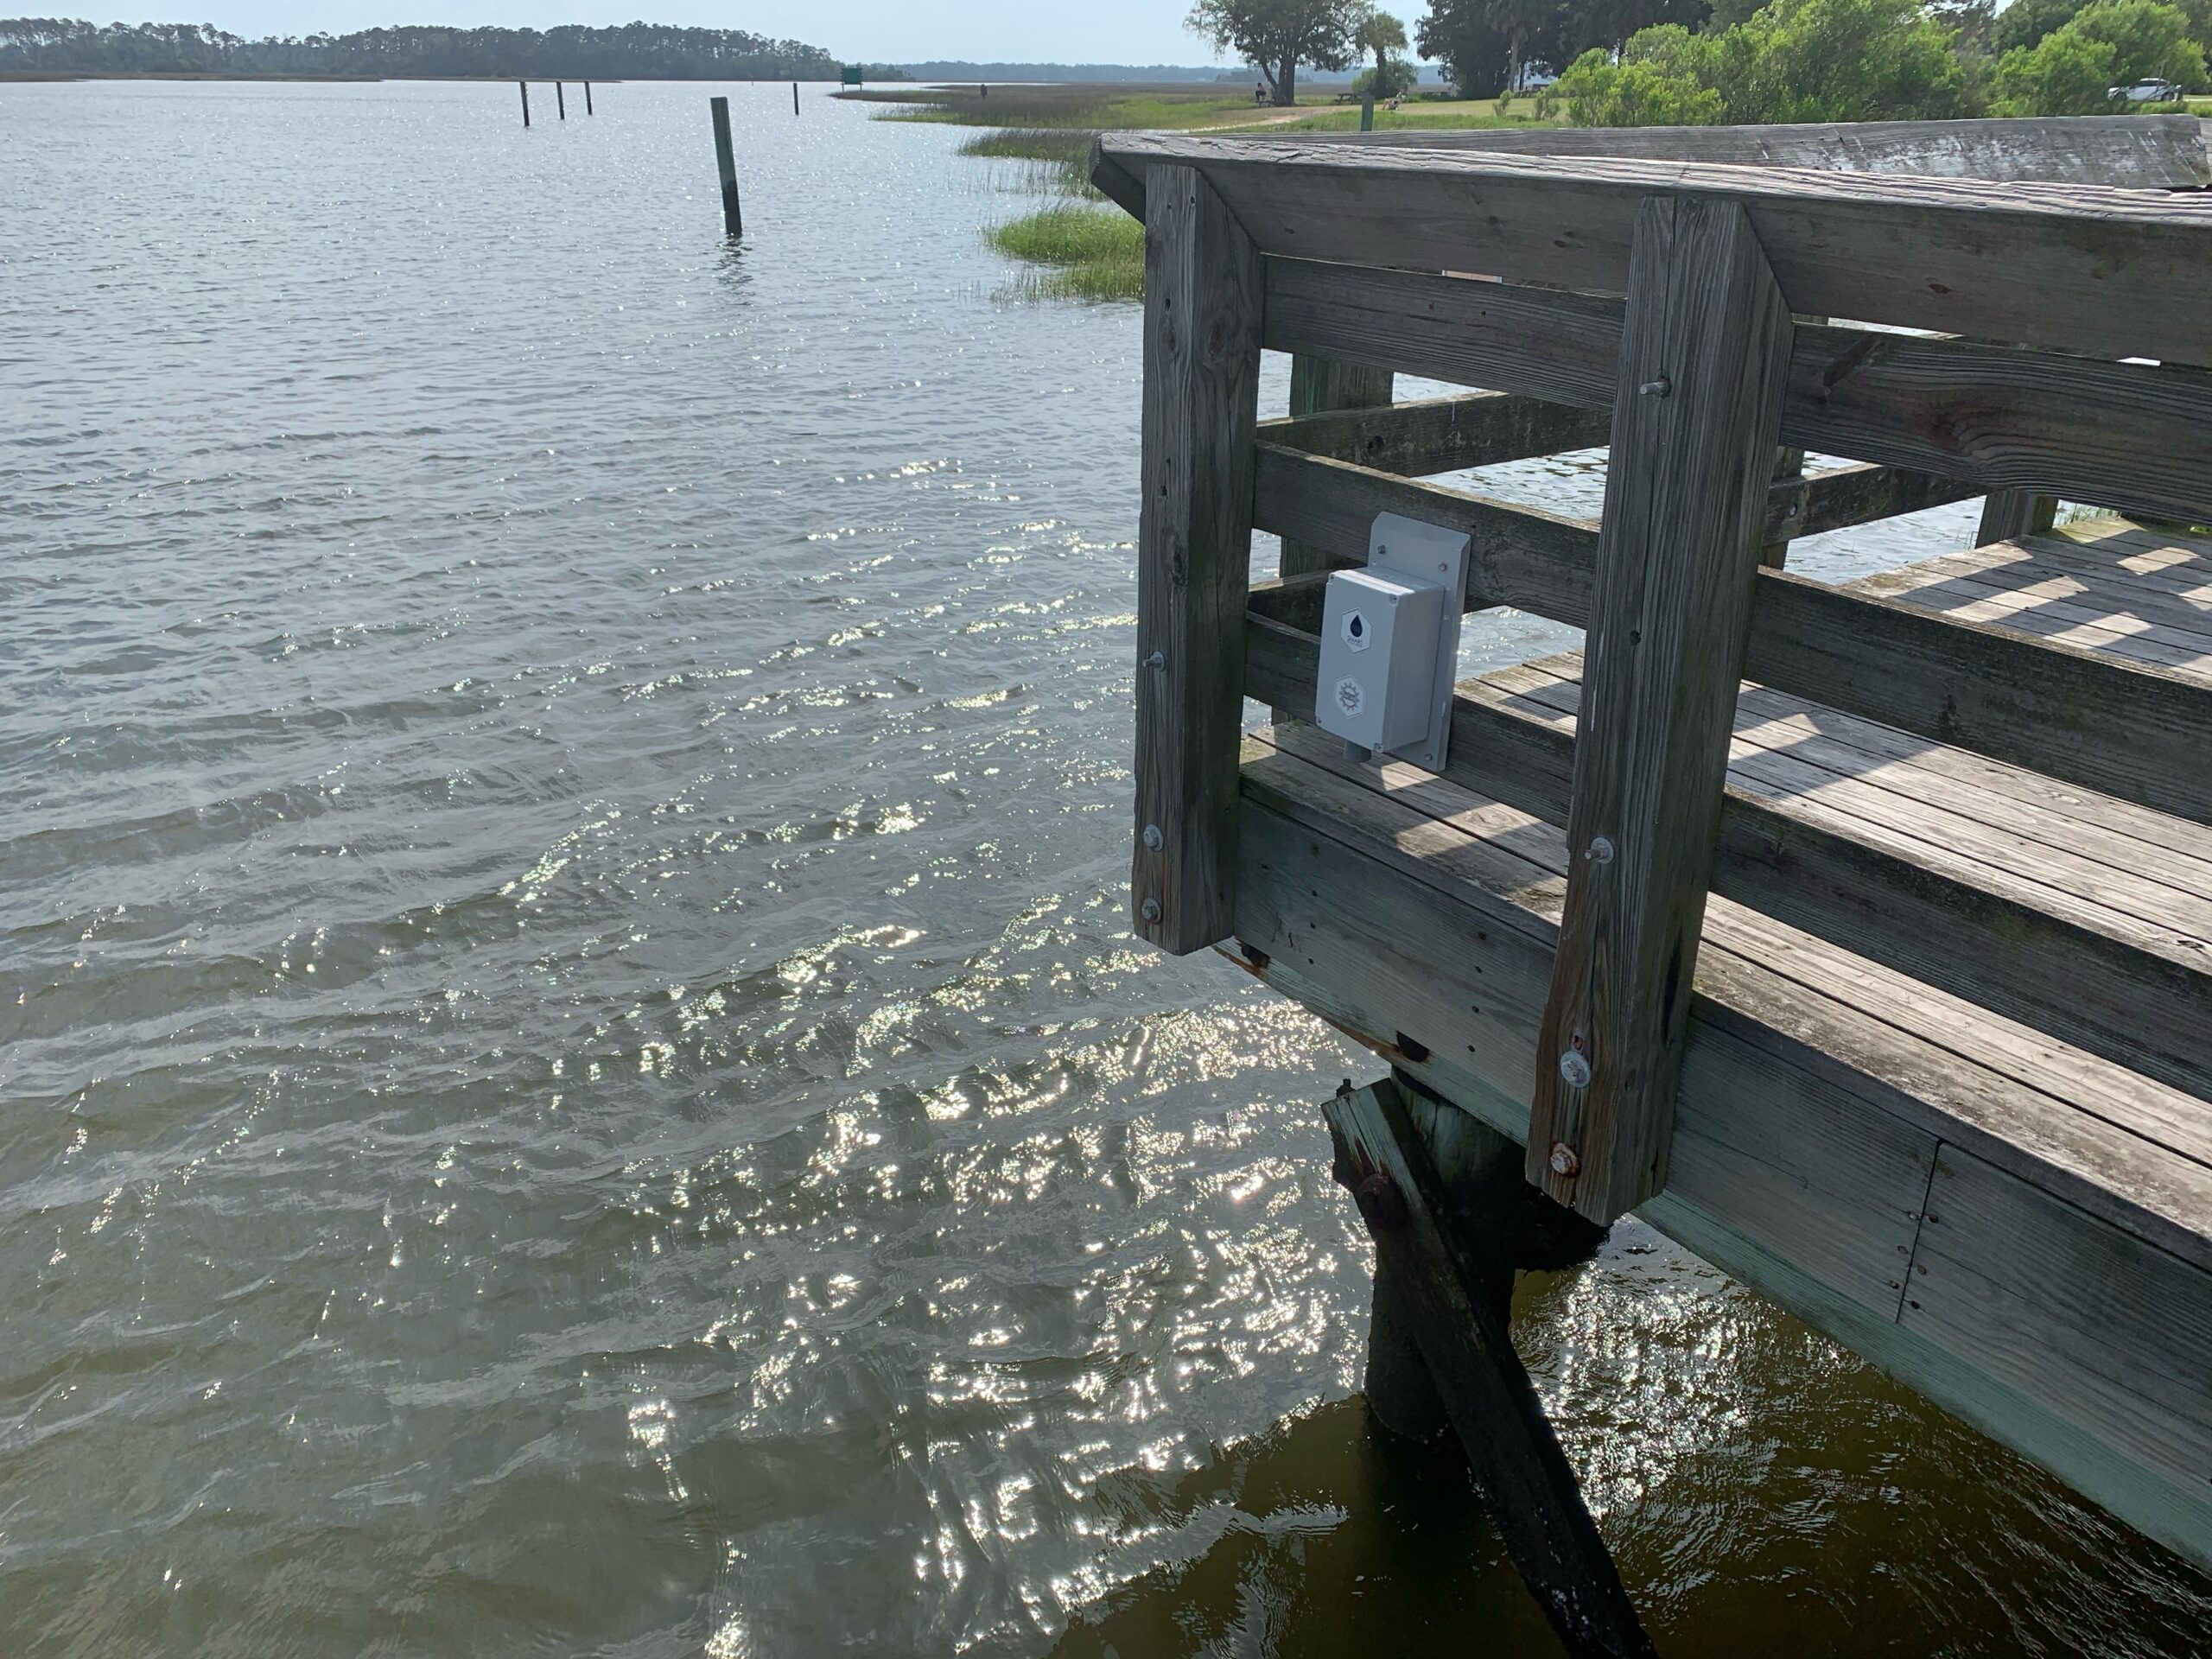
The Ocean Sensor Visualization Project draws data from sixty-two (62) enclosures currently (January 2024) located through out Chatham County, Georgia, other counties and states are involved as well. Each enclosure can house from one to six sensors, from my understanding the main goal is to monitor sea level modulations over a series of time so that county officials can make better decisions in the future, many of these enclosures have expanded to include air pressure, air temperature, relative humidity, rain gauge and battery voltage sensors. Please see video below for more information on enclosure construction and operation.
The enclosures are scattered through out the county. There is a mixture of public land and private water access that the enclosures are mounted on. Some of the locations have photographs, pictures will auto-populate when the modal is loaded. This application retrieves data from an API that the Smart Sea Level Sensors Project team has built to allow for software developers as myself to query data. The application then parses and displays the data in chart and latest observation tab. Due to browser and bandwidth limitations, the maximum days of history allowed through this application is 30 days. Mapping controls are typical of most mapping services coupled with push on/push off layer control.
The sensor network will stretch from Interstate 95 to Tybee Island, capturing a wide range of tributary sizes, orientation, and building densities. The data collection will be complemented by a suite of modeling tools to inform flood risk and vulnerability, including a high-resolution coastal ocean model as well as an integrated hydrological model to capture surface runoff during high precipitation events. Taken together, the framework enables the assessment of short-and long-term coastal flooding risk and vulnerability that are required to inform planning for flood mitigation strategies.
This is the first project of its kind in the region, and our goal is to provide a template for expansions of this technology and community stakeholder framework to other areas of vulnerable coastline along the southeastern US.
(Quoted from the About section of The Smart Sea Level Sensors Project website)
The tech stack I chose for this project is Django, Javascript and Bootstrap 5. A SQLite database is maintained with tables for the enclosures and sensors, their observations and status are updated approximately every 20 minutes. When the client clicks on a location, an Ajax call is made to the server returning location, photos and latest observations. I used Mapbox as a mapping service due to their ease of use and detailed satellite imagery. If a request is made to view charts, the client will then query the data API directly and render the indicated history. Highcharts was chosen due to their simplicity, quality examples and truly flexible options along with previous experience on other projects.
All of this development occurred within a Pycharm IDE and JSFiddle on a Linux machine. The Django MVT framework is hosted on a Linux server with Gunicorn for communicating Python duties and Nginx functioning as the webserver.
I would like to give a special thanks to all of the people and organizations that have built and contributed to this project.
Under no circumstances shall Brent Webre Automation be liable for damage or loss of any kind, user assumes entire risk, application is for general information purposes only and is provided as is.
Copyright © Designed & Developed by Brent Webre Automation All rights reserved.
 Brent Webre Automation
Data provided by Smart Sea Level Sensors Project


